InfluxDB is a great time-series database for storing server performance metrics like CPU load, memory utilization, network usage, etc. Unlike traditional relational databases like mysql, InfluxDB can store this data in a much smaller amount of disk space while returning the data at much faster rate.
This means we can greatly increase the resolution of our graphs by collecting more data to make our statistics more granular. We are going to poll our systems using collectd every 10 seconds, send this data over the network to our InfluxDB server which has built-in capabilities to read this collectd formatted data. Then we will use another growing-in-popularity opensource tool called Grafana (forked from Kibana) to display this data from InfluxDB in a beautiful dashboard. Here is a quick guide to get you started:
# install and configure collectd
root@watcher ~ $ yum install epel-release
root@watcher ~ $ yum install collectd

# add this file
root@watcher ~ $ vim /etc/collectd.d/influxdb.conf
LoadPlugin network
<Plugin network>
	Server "127.0.0.1" "25826"
</Plugin>

# enable and start collectd
root@watcher ~ $ systemctl start collectd
root@watcher ~ $ systemctl enable collectd

# follow these instructions from: https://influxdb.com
root@watcher ~ $ wget https://s3.amazonaws.com/influxdb/influxdb-0.9.3-1.x86_64.rpm
root@watcher ~ $ yum localinstall influxdb-0.9.3-1.x86_64.rpm

# clean up a bit
root@watcher ~ $ mkdir /etc/influxdb/
root@watcher ~ $ mv /etc/opt/influxdb/influxdb.conf /etc/influxdb/influxdb.conf.orig
root@watcher ~ $ rm -rf /etc/opt/influxdb
root@watcher ~ $ /opt/influxdb/influxd config > /etc/influxdb/influxdb.conf
root@watcher ~ $ chown -R influxdb:influxdb /etc/influxdb/

# modify, change config
root@watcher ~ $ vim /etc/init.d/influxdb
CONFIG=/etc/influxdb/influxdb.conf

# modify, enable collectd
vim /etc/influxdb/influxdb.conf
[collectd]
  enabled = true
  bind-address = ":25826"
  database = "collectd"
  retention-policy = ""
  batch-size = 5000
  batch-timeout = "10s"
  typesdb = "/usr/share/collectd/types.db"

# enable and start influxdb
root@watcher ~ $ chkconfig influxdb on
root@watcher ~ $ service influxdb start

# create database for collectd
root@watcher ~ $ curl -G 'http://localhost:8086/query' --data-urlencode "q=CREATE DATABASE collectd"
root@watcher ~ $ curl -G 'http://localhost:8086/query?pretty=true' --data-urlencode "q=SHOW DATABASES"

# install, enable, start grafana
root@watcher ~ $ yum install https://grafanarel.s3.amazonaws.com/builds/grafana-2.1.3-1.x86_64.rpm

root@watcher ~ $ systemctl start grafana-server
root@watcher ~ $ systemctl enable grafana-server
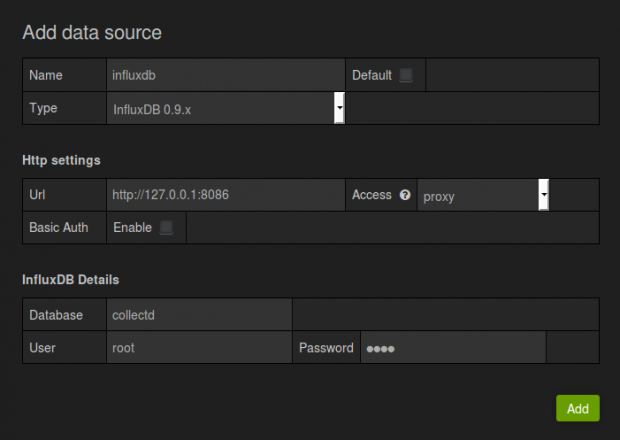
open your browser to this server’s port 3000 (http://x.x.x.x:3000) to connect to grafana, then add influxdb to data sources by clicking Data Sources > Add new. See below (u:root/p:root)
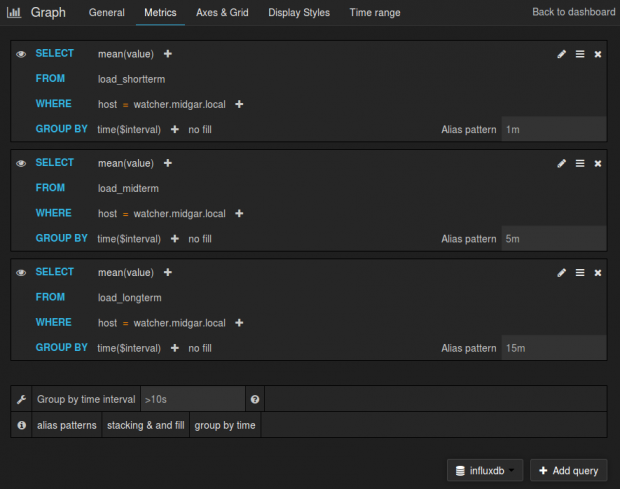
Now to make a graph, click Dashboards > Home > New; then Add Panel > Graph; then click on graph title > edit and follow screenshot below.
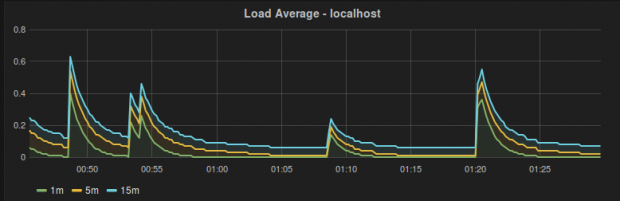
After playing around with some of the other settings (like stack) and clicking save dashboard (top), you should get a graph similar to: